

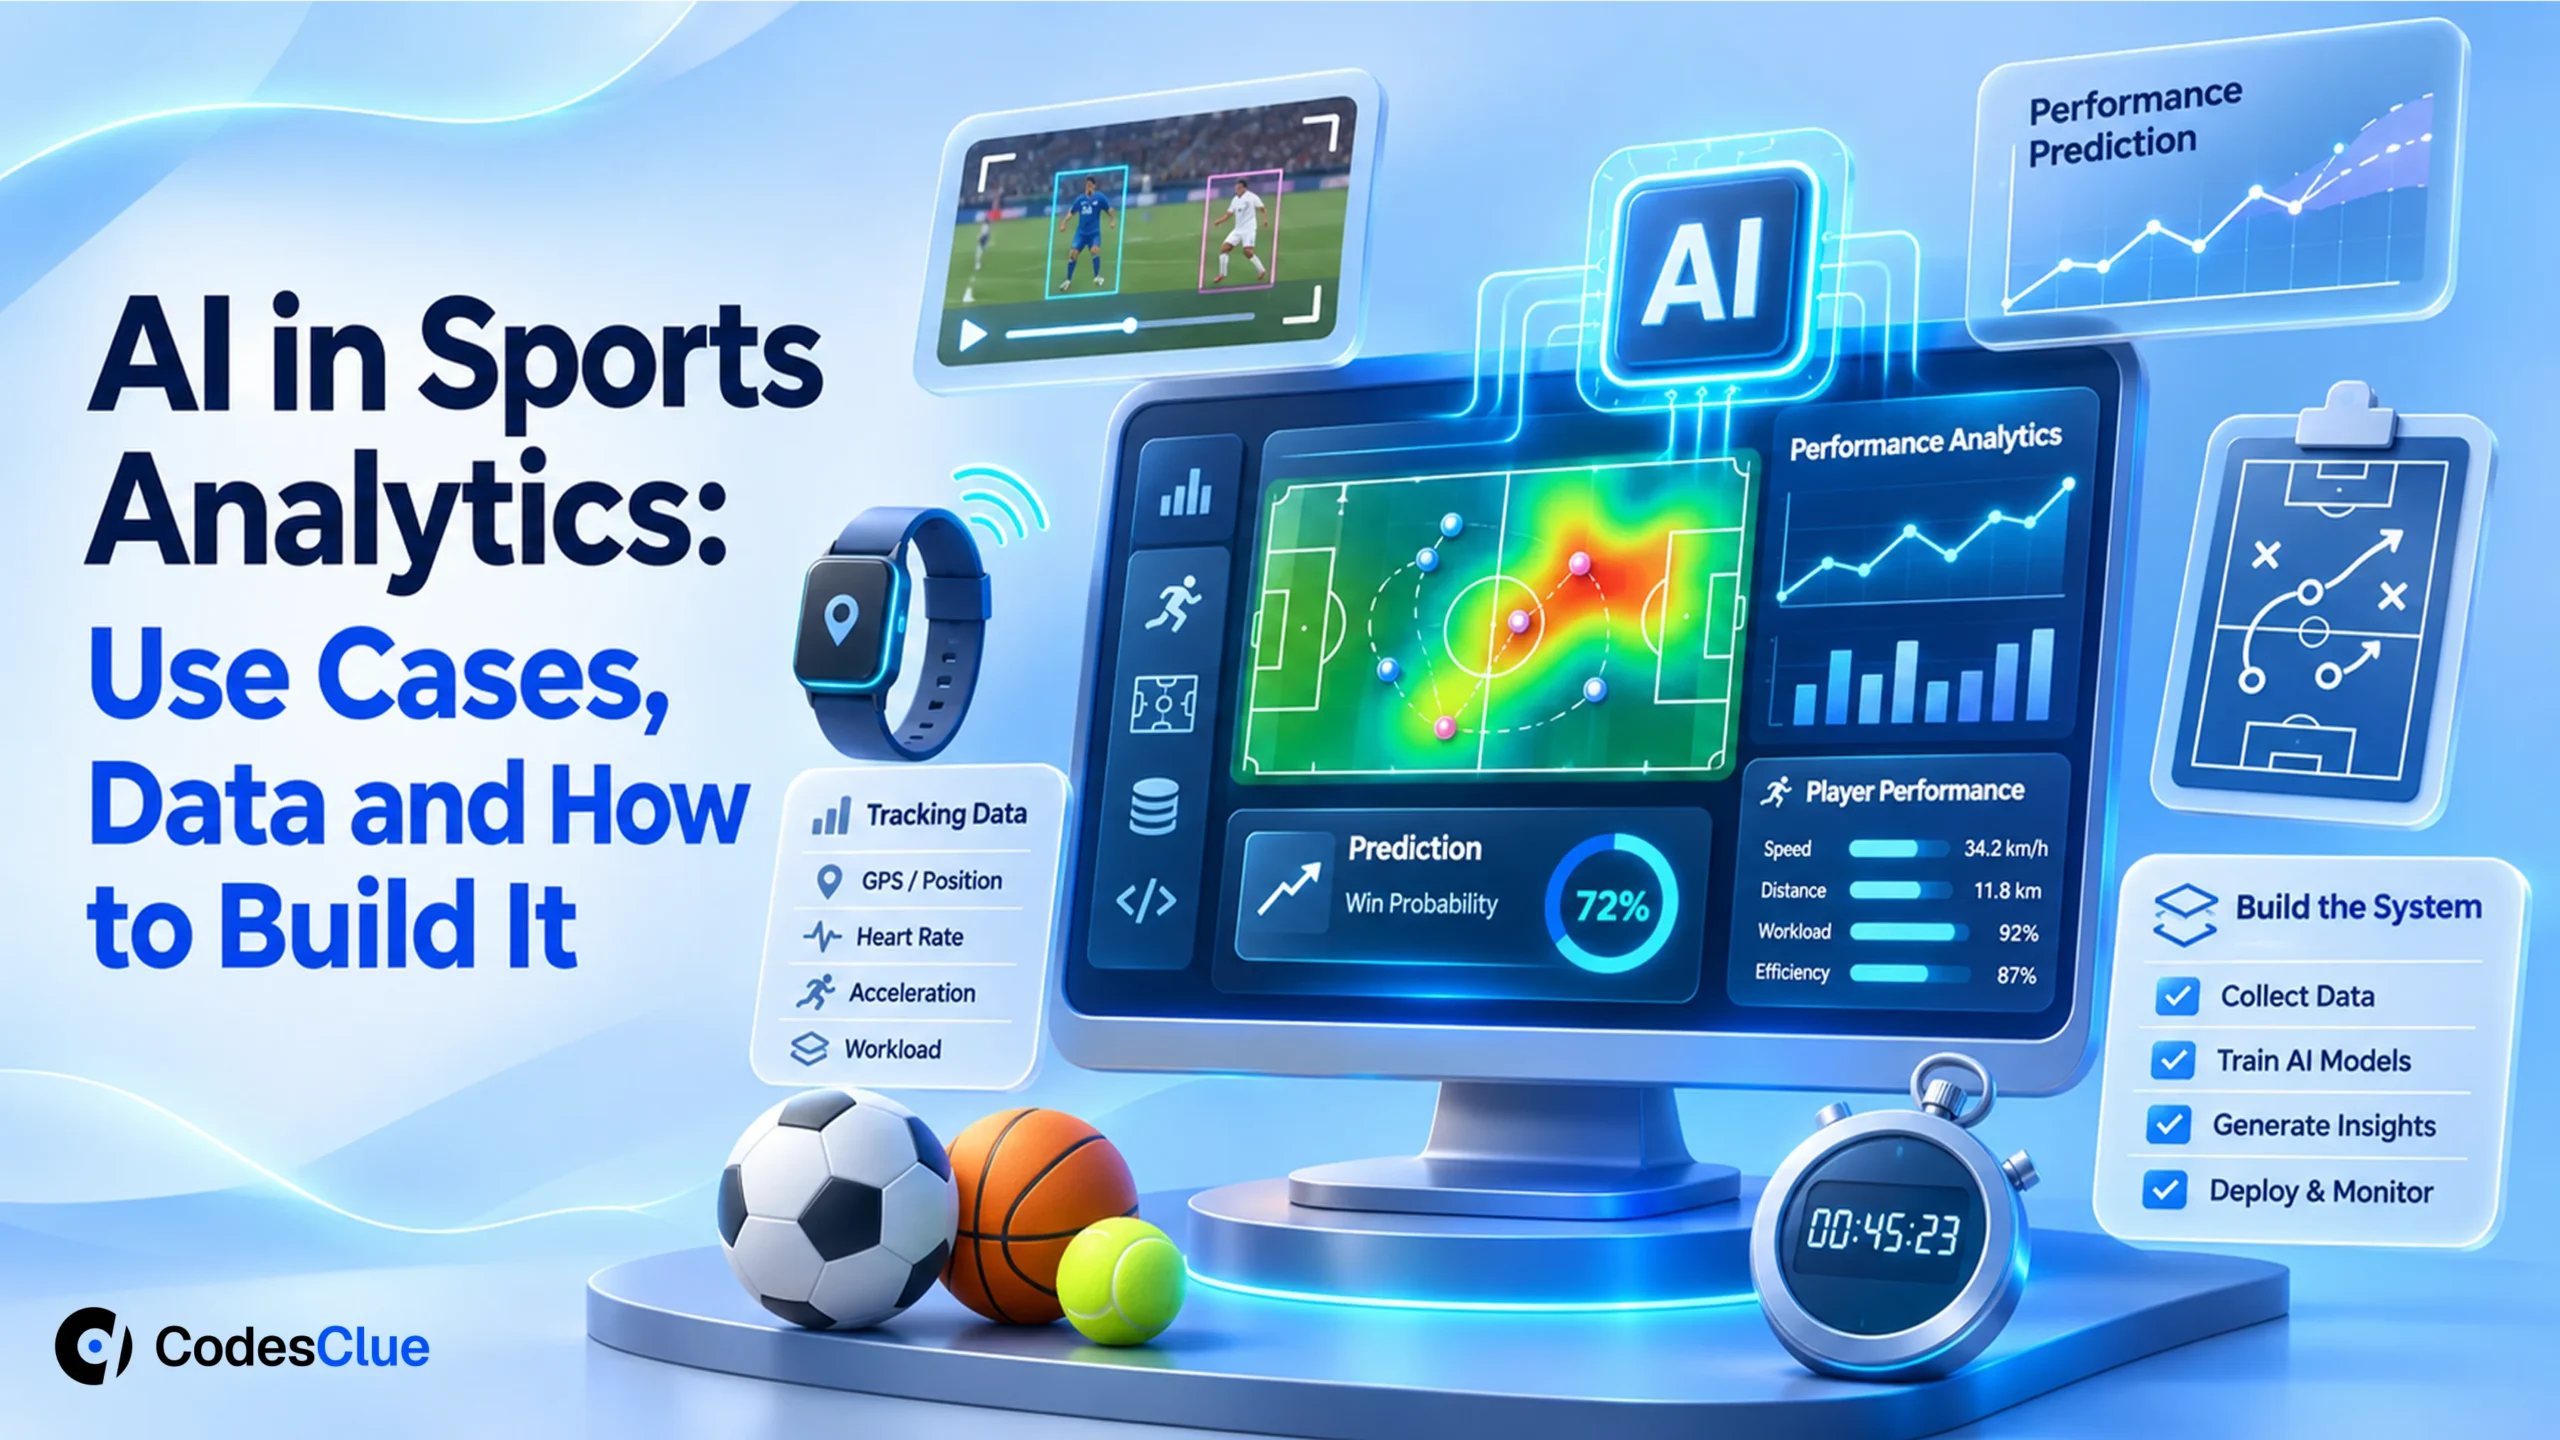
AI in Sports Analytics: Use Cases, Data and How to Build It
AI in sports analytics for clubs, leagues and media: real use cases, data sources, build vs buy, 6 build steps and honest cost bands for 2026.
Your analysts spend Monday cutting match video by hand, and the coaches want answers by Tuesday. Or your startup has a sharp idea for player insights but no clear plan for the data behind it. Either way, AI in sports analytics sounds promising and vague at the same time.
This guide makes it concrete. You will see what the AI does for clubs, leagues and media teams. It also covers where the data comes from, how to build a first version and what it costs.
Key Takeaways
- AI turns raw tracking, video and wearable data into decisions a coach, scout or producer can act on the same day.
- The data decides the project. Stadium tracking, broadcast video, GPS vests and event feeds each bring a different cost and level of detail.
- Start with one question, such as “who should train lighter this week?”, and one data source you already own.
- UK and EU rules treat injury and health data as special category data, so plan consent and access from the first sprint.
- At CodesClue, a focused first release usually sits in the $8K to $25K band, and a full platform starts from $70K.
What does AI in sports analytics actually do?
AI in sports analytics uses machine learning and computer vision to turn game video, player tracking, wearables and event data into decisions. It spots patterns people miss, predicts load and injury risk, tags plays automatically and explains tactics. Coaches, scouts, league officials and broadcasters then act on the output faster than manual analysis allows.
Classic analytics counts what happened. AI adds three new jobs on top of the counting.
| Job | What it means | Example in sport |
|---|---|---|
| See | Computer vision finds players, the ball and body joints in video | Offside lines, automatic play tagging, sprint counts from a single camera |
| Predict | Models learn from past seasons and estimate what comes next | Injury risk, expected goals, a scout’s shortlist |
| Explain | Language models turn numbers into short, plain reports | A post-match summary a coach reads on the bus home |
Money is following the idea. Grand View Research (opens in a new tab) puts the AI in sports market at $10.6 billion in 2025 and expects $49.9 billion by 2033.
Who uses it, and for what?
Each type of sports business asks different questions. Find your own line in the table first, then read the league examples below it.
| Buyer | Top use cases | Typical data |
|---|---|---|
| Professional club | Training load, injury risk, opponent analysis, scouting shortlists | GPS vests, tracking feeds, video, medical notes |
| League or federation | Officiating support, integrity checks, shared stats for every club | Stadium camera tracking, official event feeds |
| Broadcaster or media firm | Automatic highlights, live graphics, archive search | Broadcast video, event data |
| Fan app without betting | Personal highlight reels, live stats, plain-language match summaries | Event feeds, short clips, app usage |
| Academy or grassroots club | Phone-video analysis, skill tracking, player development reports | Phone video, entry-level wearables |
What the big leagues already run
- FIFA. At the 2022 World Cup, its semi-automated offside technology (opens in a new tab) used 12 cameras under the stadium roof. They tracked up to 29 points on each player, 50 times per second. A sensor inside the ball sent data 500 times per second, and AI combined both streams to alert the video officials.
- MLB. Statcast (opens in a new tab) runs on 12 Hawk-Eye cameras in every ballpark. Five high-speed cameras follow pitches and bat swings, and seven follow players and batted balls.
- NFL. The league and AWS created the Digital Athlete (opens in a new tab). It runs millions of simulations from practice and game video to flag the players at the highest injury risk. All 32 clubs can open its team portal.
Pro tip: Copy the habit, not the hardware. In every league example above, the AI suggests and a person makes the final call. Build that review step into your own product from day one.
Where does the data come from?
Your data source sets the cost, the detail and the legal work. Most clubs and startups already own more of it than they think.
| Source | What it captures | Cost to get | Watch out for |
|---|---|---|---|
| Optical tracking (stadium cameras) | Position of every player and the ball, many times per second | High, usually through the league or venue | Your contract may not let you reuse the raw feed |
| Match and training video | Everything the camera sees, once computer vision reads it | Low if you already film | Camera angles change and players hide each other |
| Wearables (GPS vests, heart rate straps) | Speed, distance, accelerations, heart rate | Medium per squad | Health data rules, battery life, poor fit |
| Event data | Passes, shots, fouls and substitutions with time stamps | Medium, bought from a provider | Providers define a “key pass” in different ways |
| Medical and wellness logs | Injuries, sleep, soreness scores | Low | Special category data under UK and EU law |
| Business data | Tickets, app use, CRM records | Low | Marketing consent from each fan |

Many GPS vests also carry an IMU, a motion sensor that measures acceleration and rotation. It counts jumps, tackles and changes of direction that GPS alone misses.
Plan the privacy side early. The UK regulator, the ICO, says data concerning health (opens in a new tab) covers information about injury and disease risk. You need an Article 9 condition before you process it. Athletes also deserve to know who sees their numbers.
Pro tip: Start with the video you already record. Computer vision can pull positions, sprints and shapes out of tactical footage, so you can test ideas before you sign a tracking contract.
How to build an AI sports analytics platform in 6 steps
We would run a new sports data product in this sequence. Every step leaves your staff something to test.
- Pick one question and one user. For example, “Which players should train lighter on Thursday?” for the head of performance. Write down what a useful answer looks like.
- Audit your data. List each source, its owner, its format and how many seasons it covers. Ask your league or vendor in writing whether you may use its feed for your own models.
- Build the data pipeline first. Pull every feed into one store, fix the clocks and match player IDs across sources. This step usually takes longer than the model.
- Train a baseline and test it on last season. Compare the model with what your staff predicted at the time. If it cannot beat a simple rule, fix the data before you add more AI.
- Put the output where staff already look. That might mean a dashboard, a morning message in the team chat or a tablet view on the training ground.
- Release to one squad, then widen. Track whether staff act on the output. Retrain on fresh data each month, and add a second question only after the first one earns trust.
Have a sports data question your team keeps asking? Tell us about it, and we will point out the step where your data needs the most work.
Pro tip: Version your data schema from the start. New sensors and new providers arrive every season, and a versioned schema lets you add them without breaking last year’s reports.
Build vs buy: which route fits you?
You do not always need custom software. Catapult sells wearables, Hudl sells video tools and Stats Perform sells event data. Buy them for standard needs, and build where your edge lives.
| Your situation | Best route | Why |
|---|---|---|
| Amateur or semi-pro club with one analyst | Buy a video and tagging tool | A subscription plus a good analyst goes further than a custom build |
| Pro club with vendor data in five different places | Build one data layer on top of the tools you buy | You keep your vendors and own the joined-up view |
| League or federation | Build shared services, buy the sensors | Every club needs the same numbers, and you set the rules |
| Sports tech startup | Build | The model and the data are the product |
| Broadcaster or media firm | Blend: buy the feeds, build the highlight and graphics engine | Speed on match day decides the value |
When we would not build it
- Small data. One squad of 25 players and a single season will not train a reliable injury model. Clear rules and a good dashboard will serve you better.
- No data rights. If you neither own nor license the tracking feed, sort the contract before any code.
- No owner on staff. If nobody will change a session plan because of the output, the model will sit unused.
How much does it cost?
Published market ranges vary widely. Apptunix lists $30,000 to $60,000 for a basic sports performance analytics MVP and over $120,000 for an advanced system. Idea Usher puts a full AI analytics platform for sport at roughly $10,000 to $100,000.
Our own bands depend on scope, data sources and how much video work you need.
| Release size | What it includes | Our price band |
|---|---|---|
| MVP | One question, one or two data sources, a clean pipeline, a baseline model and a dashboard | $8K to $25K |
| Mid-size | Several sources joined, computer vision on your own video, a coach app and monthly retraining | $25K to $70K |
| Large | Multi-team or league platform, live match-day data, role-based access and partner integrations | From $70K |
Budget for running costs too: data provider licences, cloud GPU time for video, video storage and regular retraining. Our machine learning development cost guide breaks these down, and our AI predictive analytics guide explains how to judge a forecast before you trust it.
Our related work, told honestly
We have not shipped a sports analytics product. The projects below use the same building blocks.
- Nexus PTT. Our client, a US firm in sports and live events, needed push-to-talk radios that keep working in packed stadiums, arenas and emergency scenes. We built native Swift and Kotlin apps, a Node.js backend and an operator dashboard with session telemetry. The case study reports 500+ concurrent users and a 98% device pairing success rate.
- AirShield. Sensors stream data around the clock over AWS IoT Core. Each sensor type gets a versioned schema, so the team can add newer hardware while older data keeps flowing. Swap air sensors for GPS vests, and the pipeline looks much the same.
- Therapix.AI. The AI turns session inputs into structured notes, and clinicians review and approve each one. A scouting or match report should follow the same pattern: the AI drafts, the analyst signs off.
What we see in real projects: packed venues are hard on radios and networks, so Nexus PTT taught us to test on site early. Plan a match-day trial before you promise live numbers to coaches or broadcasters.
Pro tip: Treat athlete data and fan data as two separate systems with separate access rules. A marketing tool should never be able to read an injury log.
Common mistakes to avoid
- Buying sensors before you pick the question. The question tells you which data you need, not the other way round.
- Trusting a model trained on one season. Injuries are rare events, so small samples give confident but wrong scores.
- Ignoring who owns the data. League and vendor contracts may limit how you reuse tracking feeds.
- Skipping the baseline. Without a “staff guess” to beat, nobody can tell whether the AI helps.
- Building a dashboard nobody opens. Send the one number that matters to the place staff already check.
Checklist before you start
- We wrote down one question and the person who will act on the answer.
- We listed every data source, its owner and our right to use it.
- We know how many seasons of clean data we hold.
- We have a consent and access plan for health and injury data.
- We agreed what “better than today” means, with a number.
- We set aside budget for licences, cloud time and retraining.
Getting started with AI in sports analytics
AI in sports analytics pays off when it answers one question your staff ask every week, from data you own, faster than a person can. Start small, show the reasoning and earn trust before you add live match-day features.
At CodesClue, AI shapes the design from the first workshop rather than arriving as a late add-on. Our engineering base sits in Ahmedabad, and we run offices in Malvern, Pennsylvania and Dortmund, Germany.
A sports idea moves through three stages. First comes a proof of concept built on data you already hold, next an MVP your staff use daily, and finally a production platform. We deliver each stage in short Agile sprints, with our computer vision, machine learning and data analysis teams on one squad.
For a coach or fan app, our mobile app team joins too, backed by our wider AI development practice.
Send us your question along with a few weeks of sample data. We will come back with a scope for the first release and the band it falls in. Prefer to grow your own team? Our AI developers and Python developers can join you, and development starts within 48 hours.
Frequently Asked Questions
How accurate are AI injury risk predictions?
Treat them as an early warning, not a diagnosis. Injuries are rare, so a model needs several seasons of clean load, wellness and injury records before its scores mean much. Even then, the useful output is a ranked list of players to check, which the medical staff confirm or reject. Judge the model on last season first, and compare it with what your physios flagged at the time.
Who owns the tracking data a league collects at our games?
It depends on your league and vendor contracts, and the answer differs between competitions. Some leagues share raw tracking with clubs, while others share only summary stats or limit use for your own models. Read the data clauses before you plan a build, and ask for written permission if the contract is unclear. Your own training video and wearable data are usually easier to use.
Do athletes need to consent to wearable tracking?
Not always, but you need a legal basis for every use. Under UK and EU GDPR, health data needs an Article 9 condition. Explicit consent is one option, and employment law duties are another. Consent from a contracted player can be hard to call freely given. Write a clear notice, limit who sees the data, and check the exact basis with a privacy lawyer.
How long does a first AI sports analytics release take?
A focused release, built around one question, a dashboard and no more than two data sources, often fits into a few weeks to a few months. Cleaning and joining the data takes most of that time. Live match-day features, computer vision on broadcast video and league-wide platforms take several months. Apptunix, for example, lists up to three months for a basic MVP and six to nine months for an advanced system.
Will AI replace our performance analysts?
No. It removes the slow parts of the job, such as tagging every pass by hand or building the same report each week. Analysts then spend more time on the questions that need game sense, talking to coaches and checking odd results. We suggest giving your analysts ownership of the models, since they know which numbers the coaches trust.